Portfolio
Projects
Pick a project to read the full case study — each card shows the theme it tackles and the skills behind it.
SideQuest · Tech & AI Build
SkyCacher
skycacher.netlify.app
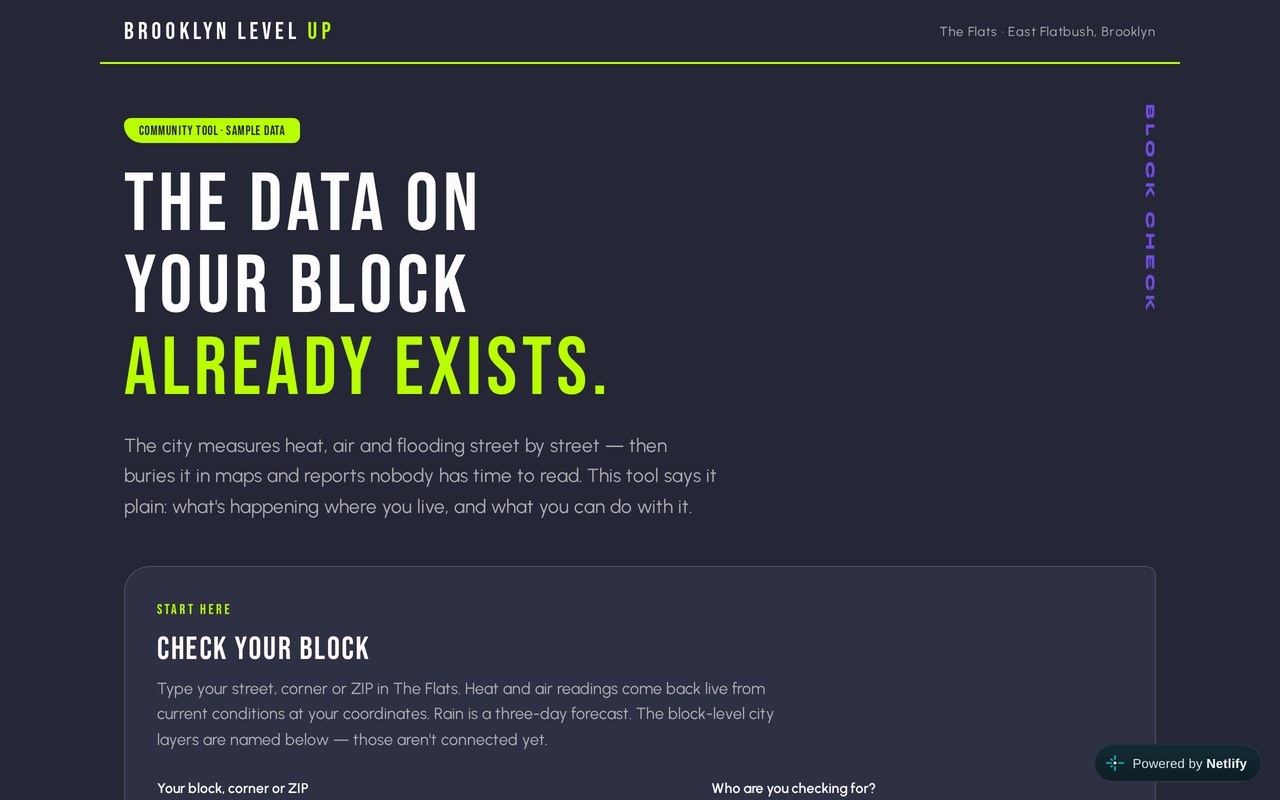
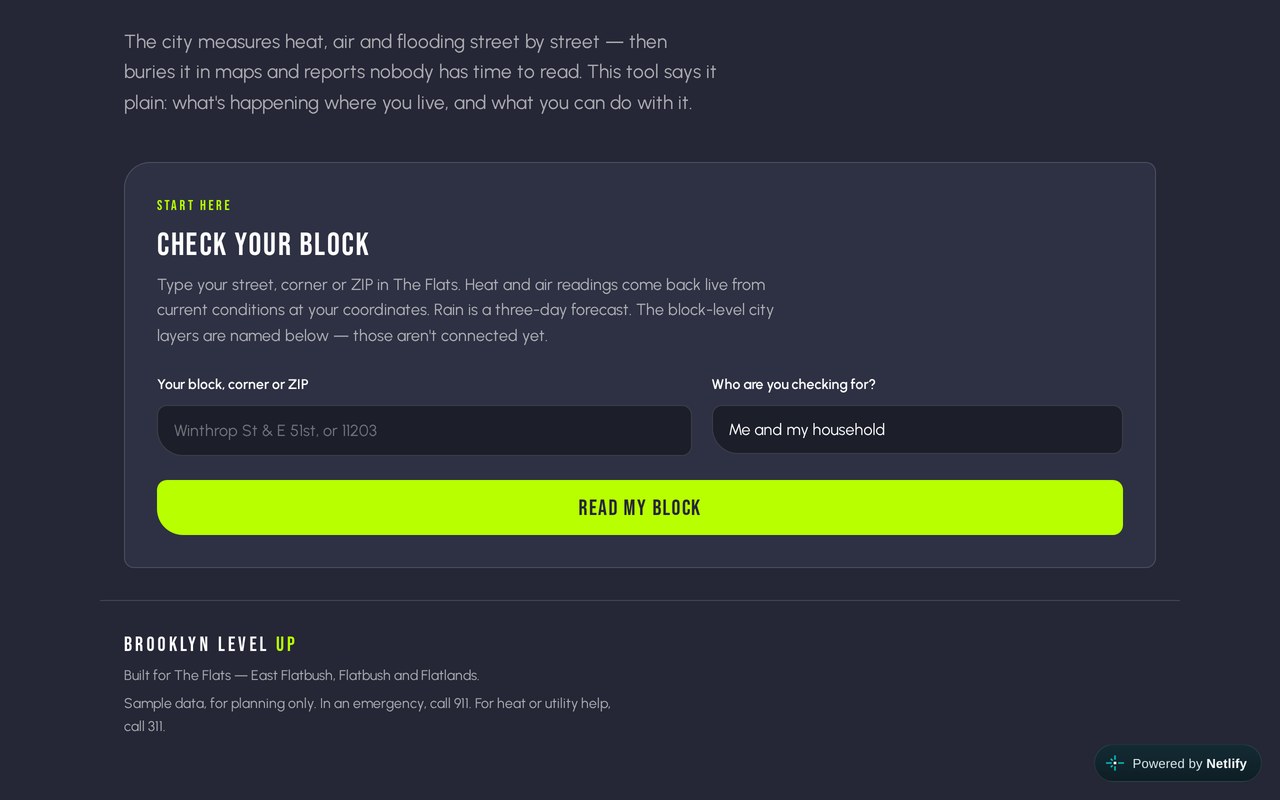
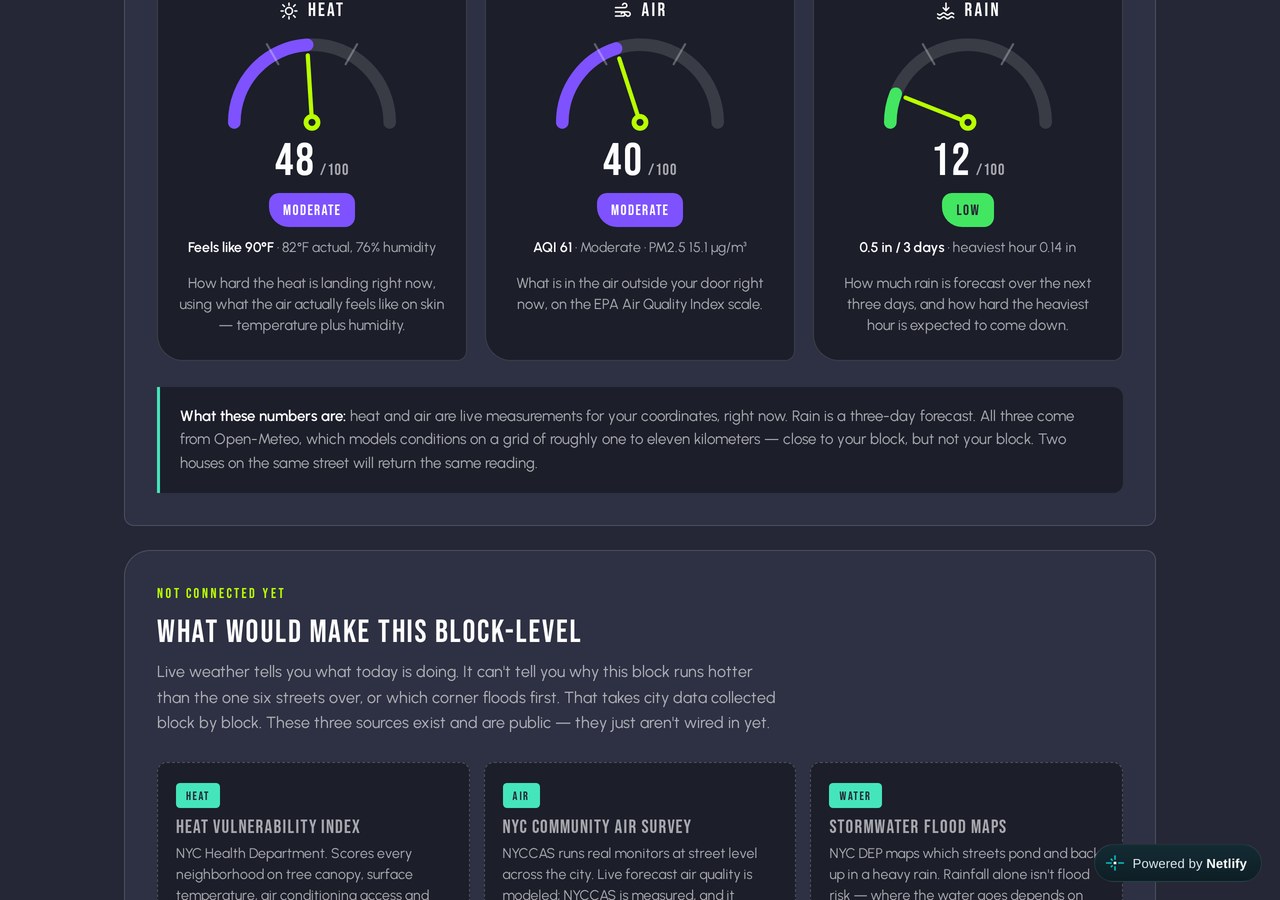
The Challenge
I wanted to build something in AI that wasn't just a demo notebook — software that could look at a real image, identify what's in it, and show that result in a way anyone could read. The hard part wasn't only getting detection working. It was making it presentable, and getting comfortable putting it in front of people.
What I Built
Object detection software: a build focused on getting detection functional, then refining the aesthetics of how results are displayed so the output reads clearly instead of looking like raw model output. I iterated on the visuals alongside the logic, because a tool nobody can interpret isn't finished.
My Role
Solo build — model and detection logic, interface aesthetics, and the presentation of the work itself.
Skills Used
Computer Vision · Object Detection · AI Development · Machine Learning Concepts · Visual Design · Technical Presenting
What I Learned
“Being yourself and trusting what you have to say can make a much stronger impact. I stopped treating presenting like an interruption and started treating it as part of the build.”
What's Next
Making it bigger. Dennine's session pushed me to think about reach — how a sidequest becomes something brands, companies and wider audiences actually use. That's the direction I'm taking it.
Track Project · EcoPower '26
Community Resilience Hub Survey
The Challenge
BKLVLUP is building Brooklyn's first Community Resilience Hub on Utica Avenue. Most resilience hub surveys are English-only, written by professionals for professionals, and never reach the residents they claim to represent. Before construction, before programming, the community needed to be heard.
My Role & Contribution
I built and deployed the Haitian Creole translation of the Community Resilience Hub survey — tested for reading level and format, not just translated. I also designed the concept for a 'Heat & Air Risk Check' tool: residents enter their block and get a plain-language summary of heat vulnerability, air quality and flood risk, with practical steps they can actually take.
The Data That Changed the Design
Heatstroke is the leading environmental cause of death for New York City seniors. That single finding moved cooling and elder access from nice-to-have to must-design-for — and shaped how simple I made the interface.
What I Said in the Room
“Senior citizens may not be as familiar with technology, so making navigation simple and intuitive should be a top priority.”
Impact
The survey is live in English, Spanish and Haitian Creole and collecting responses. Feedback was gathered in person at events including National Night Out at the Shirley Chisholm Center, and the research now feeds the Hub's design priorities as it moves from concept to construction.
Cohort Work · EcoPower '26
The Four Group Projects
Four cohort-wide projects carried the summer — one per track, all of it real work in The Flats, East Flatbush, built alongside community partners. I worked across the Tech & AI and Environment & Data lanes and contributed to the research behind the rest.
Tech & AI · Environment & Data
Community Resilience Hub Survey
BKLVLUP is building Brooklyn's first Community Resilience Hub on Utica Avenue, but most hub surveys are English-only and never reach the residents they claim to represent.
- First multilingual Resilience Hub survey — live in English, Spanish and Haitian Creole
- Research linking NYC Heat Vulnerability Index and DOH Heat Risk data to hub design priorities
- In-person feedback gathered at National Night Out, Shirley Chisholm Center
- Multilingual platform evaluation for ongoing data collection in The Flats
My part · Built and tested the Haitian Creole deployment, helped evaluate the data-collection platforms, and concepted the Heat & Air Risk Check tool that became SkyCacher.
Community & Civic
The Green Book — Energy Resilience Edition
What isn't documented can't be defended. Substations, green spaces, a 40-year-old Caribbean market — the assets of The Flats had never been mapped as community infrastructure.
- Interactive GIS map of The Flats built collaboratively on Felt with Ground3D
- Narrative annotations on every point, written for a phone-navigable self-guided tour
- Street interview script and findings from the Brooklyn College corridor
- Walking route assessed on foot for shade, water access and flood risk
- Published web map — 11 stops across East Flatbush, Remsen Village and Canarsie
My part · Contributed GIS research and neighborhood environmental data used to place and annotate points.
Explore the live mapCommunications
Flats Rising Communication Strategy
Emergency messaging assumes one audience, one language and one way of reading — so the people most exposed to heat, flooding and blackouts never get it in a usable form.
- Communication audit through a multi-format, multi-generational, multi-language lens
- Green Book research identifying community pact businesses with OEM and COAD
- Tested canvassing scripts for the Resilience Hub survey
- Flood preparedness awareness materials for Flats residents
My part · Supported canvassing prep and the corridor research feeding the community pact list.
Energy & Policy
Energy Clinics for Elder Residents
Heat vulnerability lands hardest on elder residents of East Flatbush, who are least likely to hear about the programs built to help them. Utility brochures don't reach them.
- Energy clinic model built for elders — heat at home, blackout prep, finding cooling centers
- Curriculum designed for accessibility over technical accuracy, in person and practical
- Bethany Terrace senior cooling event planned and documented, ready to run
- Research on elder heat vulnerability grounded in NYC public health data
My part · Contributed the Thrash analysis — the specific emergency supplies the Hub needs, including insulin, painkillers and independent generators.
Field Work
Additional Work
Thrash analysis — named the specific supplies the Resilience Hub needs during an emergency: insulin, painkillers, and independent energy generators
Community & civic research across tracks — FloodNet sensors, Community Land Trust policy, GIS tools, and neighborhood environmental data
Grounded the Hub work in the six-pillar resilience framework plus the NYC Heat Vulnerability Index and DOH Heat Risk dashboards
Contributed to the Tech & AI track's evaluation of multilingual platforms for ongoing community data collection in The Flats
- Presented at the EcoPower '26 Community Report Back